Aggregate Data Drug Information System (ADDIS) is an evidence-based decision support system for health care policy decision making that concerns alternative treatment options. It has two core functions: the input, semantic annotation and sharing of structured data from clinical trials studies, and the creation and execution of analyses based on these data. Because both data and analyses are persistent and public, we believe that such an integrated system can improve the efficiency and transparency of systematic review and health care policy decision making by several orders of magnitude.
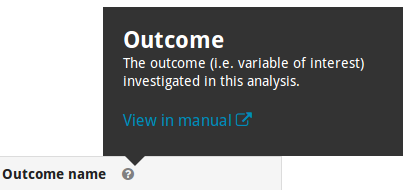
The user interface uses question mark icon to provide help for specific terms,which when clicked will show a brief explanation as well as a link to further information in this manual.
Your account
You do not need an account to explore datasets and projects created by others.To create your own datasets and projects, you must create an account.
Notice: Everyone will be able to view the datasets and projects you create in ADDIS.
Creating an account
You can create an ADDIS account simply by signing in to ADDIS using your existing Google account. If you do not yet have a Google account, create your Google account before signing in to ADDIS. After you sign in for the first time, basic personal information (e.g. your name) is retrieved from Google and stored in ADDIS. It is currently not possible to change this information in ADDIS.
Dataset management
The data in ADDIS are organised into datasets. These are abstract containers for any number of clinical trials (or studies) and any number of high-level concepts that may correspond to concepts (such as drugs or outcomes) within these studies. Datasets function as repositories for these data, allowing analytical projects to to be based on them. Each dataset is owned by a particular user, who is the only one with the right to change it. It is possible, however, to copy studies from another dataset to yours and change or extend your copy. It is also possible to create analysis projects based on a dataset owned by someone else. Datasets are created empty by default, but it is also possible to upload a dataset as an Excel file according to our custom Excel format.
Version history
ADDIS datasets are stored using a versioning system. Each version of a dataset or study gets a unique identifier, and the history of a dataset can be investigated to see what changes were made over time.
Each specific version's instance of the dataset is always available. An analysisbased on a specific version of the dataset will not change if the dataset is changed, because the changes will create a new, different, version.Any changes to a study or the concepts list are temporary at first, until you are satisfied with your changes and opt to commit them. Committing makes your changes permanent, and lets you supply a short title and descriptive message to describe the changes that you made. After committing, the specific version of the dataset that includes your changes will be available to everyone forever.
Study-oriented versus analysis-oriented
Traditional meta-analysis software treats study data in an analysis oriented way: you input study data into separate tables for each analysis, where the studies are rows. Such data tables are specific to each analysis, and the data can not easily be reused between analyses. By contrast, ADDIS stores data in a study oriented way, which means that each study extraction in ADDIS is a structured representation of what happened in that study, and what the outcomes were. Ultimately, study data should be extracted only once, and ADDIS uses matching rules to identify data eligible for inclusion in each analysis.
Creating a study
From the dataset screen, it is possible to create new studies. There are currently four ways to create a study: 1. create an empty study, with a title and description of your choice, 2. import a study from ClinicalTrials.gov, 3. upload a study as an Excel file according to our custom Excel format, and 4. copy a study from another dataset in ADDIS.
To import a study, you need to find the NCT ID of the desired study on ClinicalTrials.gov:
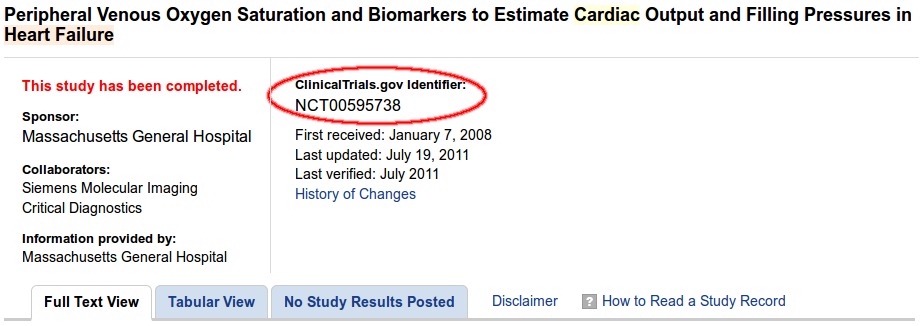
The system will show the most important details of the trial associated withthe NCT ID it is given, after which the actual import can take place.
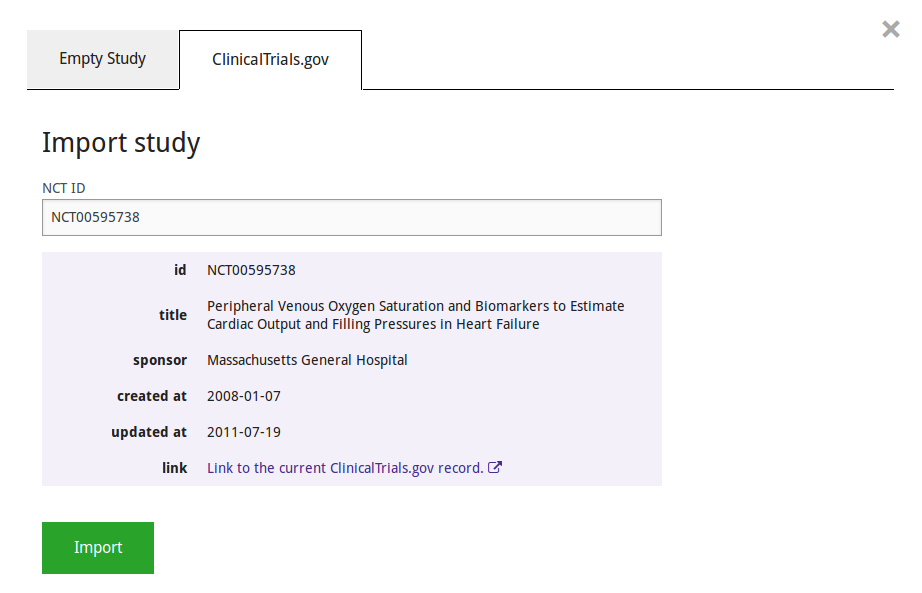
The imported study will contain nearly all the data reported in ClinicalTrials.gov. However, ADDIS expects the data to be more structured than is often the case in ClinicalTrials.gov. You may need to clean up the data before the study is ready for analysis, as described in the section "Study repair" below. Most importantly, you will need to decide which groups count as arms (i.e. paths for subjects to go through the study)
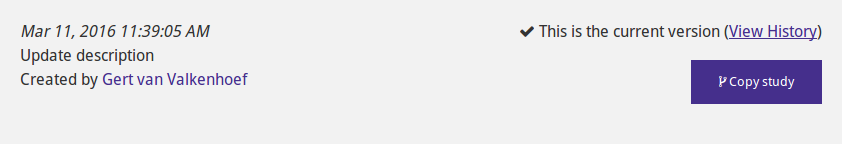
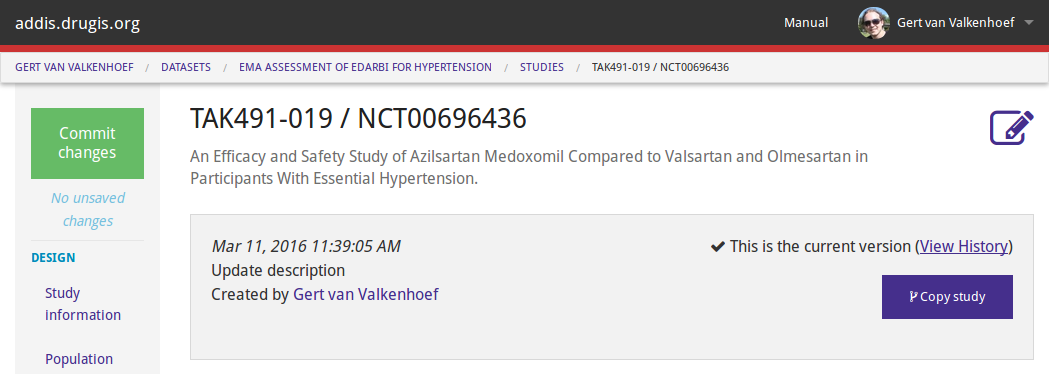
To copy a study, navigate to it either through the search screen, or by clicking on the user, dataset and study desired, and click the 'Copy Study' button at the top of the screen. The system will ask you which of your datasets the study should be copied to.
Study input
After creating a study in one of your datasets, it is possible to extend and modify its information. Here is a brief overview of study entry. We provide a guided example of study entry further below.
Study information is divided in several subsections that can be input separately (Based on the CDISC BRIDG model):
- Study characteristics, such as group allocation and population eligibility criteria.
- Arms and groups, which denote subpopulations of the study population with arms being used indicate separate paths for subjects to follow through the study, typically after randomization.
- Epochs, which indicate discrete time periods in the study's running time.
- Activities, which take place during the study, e.g. randomization, different treatments, or wash-out.
- The study design, which connects the arms, epochs, and activities: for each arm and epoch, an activity should take place.
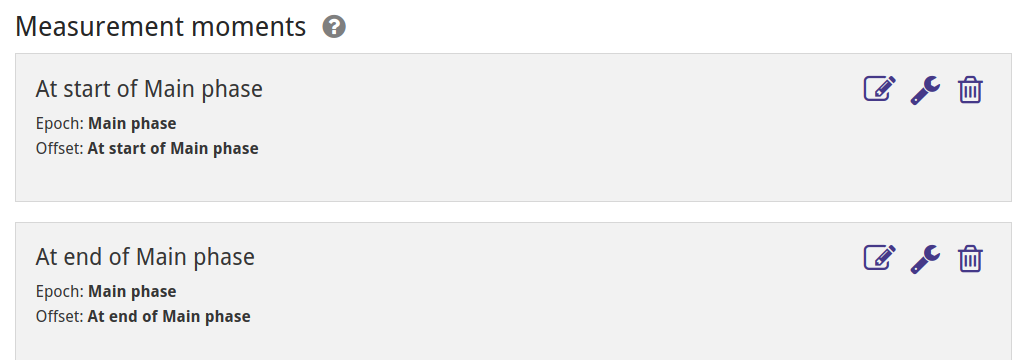
- Measurement moments, which indicate a moment during the study at which data was gathered. Measurement moments are defined as taking place a certain period of time either after the beginning or before the end of an epoch (this time period can be zero).
- Variables, meaning which events and characteristics in the population are measured, e.g. mood improvement, blood pressure, or rate of dropouts. Variables an be of three types, namely population characteristics (e.g. gender, height), outcomes (pre-specified variables of interest, e.g. pain reduction or mortality), and adverse events (e.g. nausea or headache). For each variable it can be separately indicated at which measurement moment(s) it is measured.
- Measurement results (hidden by default, and can be shown by clicking the button on the variable of interest), indicating the values that were measured during the study. Measurements consist of up to two tables for each variable, one with results that are properly structured, meaning they are assigned to a group, variable and measurement moment, and one with non-conformant measurements that do not have an associated measurement moment (see the repair section on how to fix this).
Harmonization
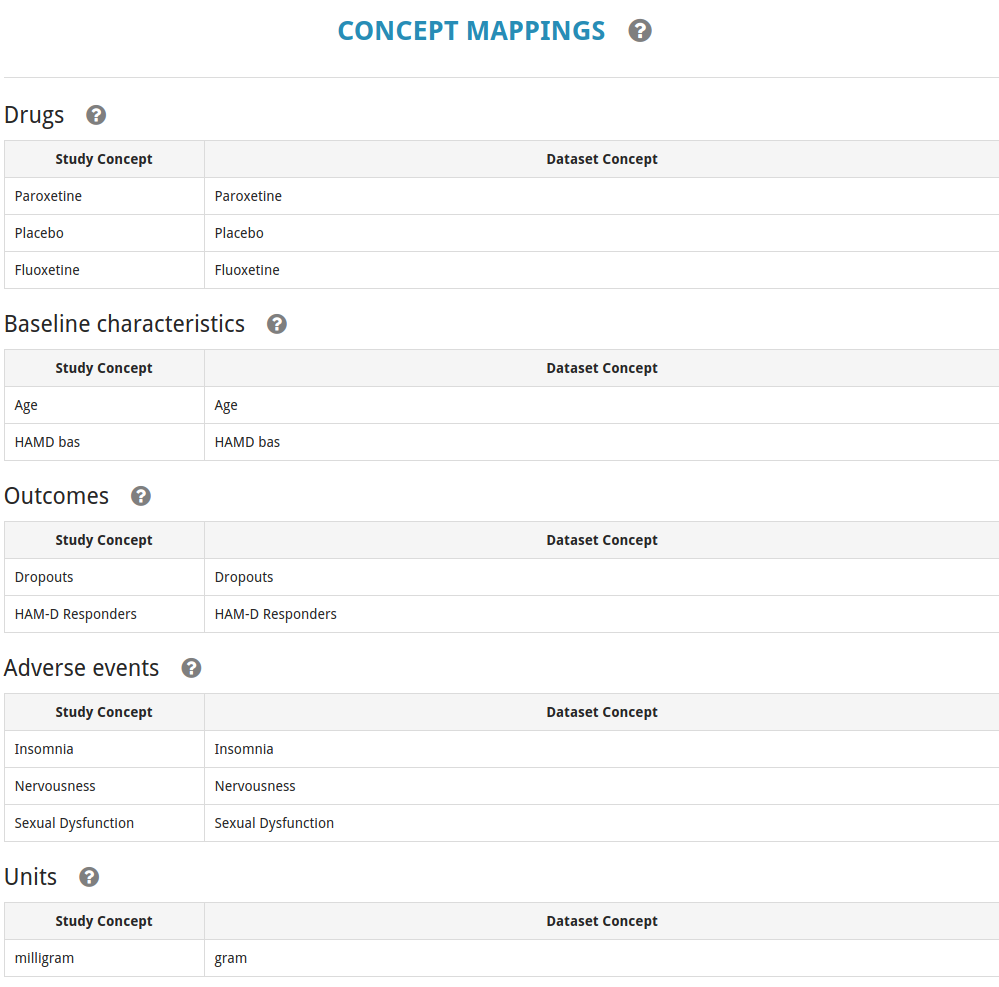
Different studies may use the same name to refer to different concepts. For example, one study may use “treatment response” to mean “a 50% or greater improvement of the MADRS score” while another may use it to mean “a 40% or greater improvement of the HAM-D score”. To allow cross-trial analyses based on a dataset, it is necessary to create concepts at the dataset level, and indicate for each concept from a trial to which dataset level concept it corresponds. This process is often called harmonization or mapping of the concepts, and is required for concepts including outcomes, treatments, and units of measure. For an example of concept creation, see below in the study entry example.
Study entry example
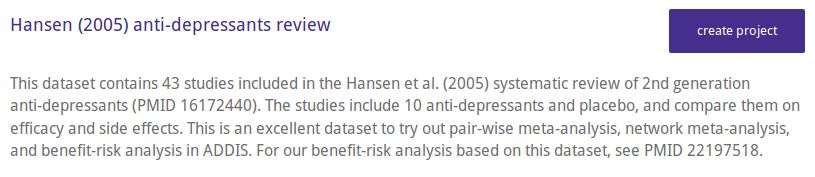
To more clearly explain the study entry process and to highlight some potential pitfalls, we here go through the process of entering an example study into the system, namely the Fava et al. 1998 study on depression also included in our example dataset based on the Hansen 2005 systematic review.
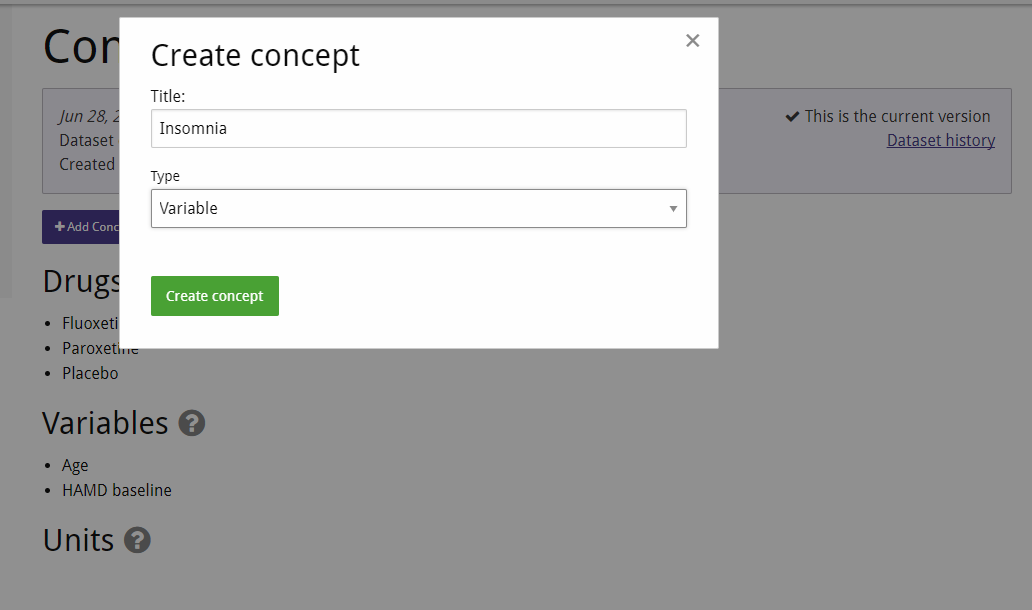
For this demonstration we assume that we already know which concepts we're interested in using our analyses. Thus, we create them beforehand, so that mapping them in the study later is simple. The concept creation screen can be reached from the dataset overview. Creating a concept is as simple as entering its desired name and choosing its type. We don't distinguish between types of variables here because what is an adverse event for one type of treatment might be a desired for a different one (e.g. blood pressure increase). Note that it's not necessary to create different concepts for different dosages of the same drug — the same drug should always be the same concept, and distinguishing interventions by dosage can be done later, when creating an analysis project.
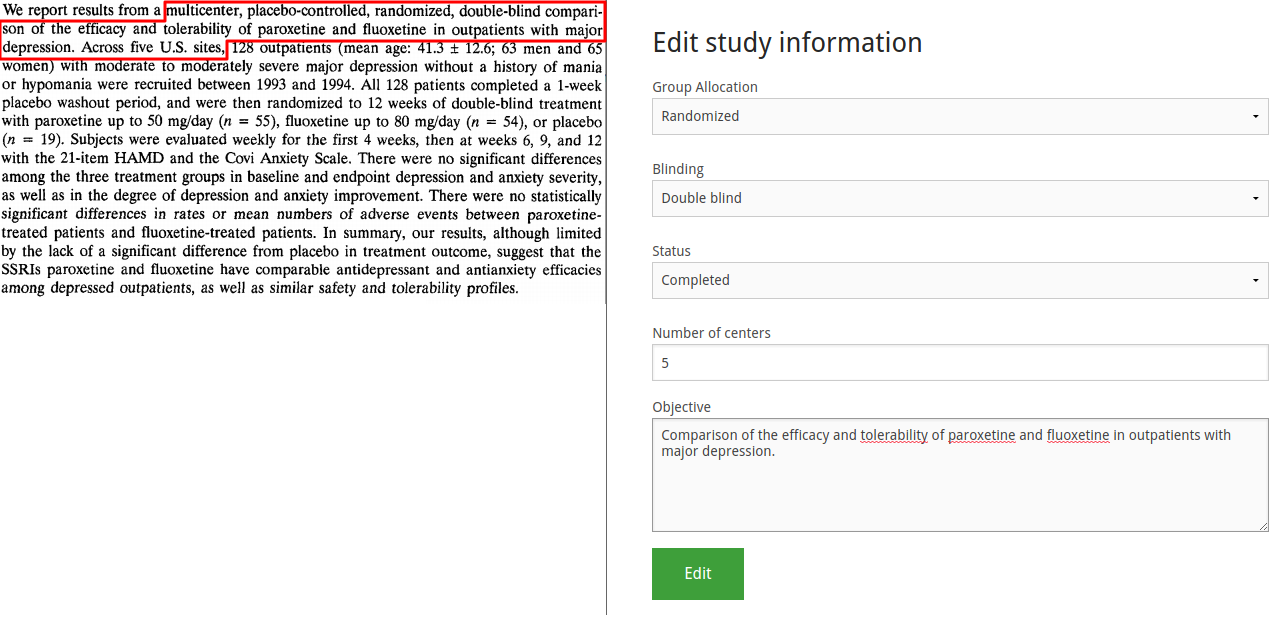
After creating our study (choosing a handy short title such as "Fava et al. 1998") we navigate to it, and begin by entering the study characteristics, most of which can be found in the abstract.
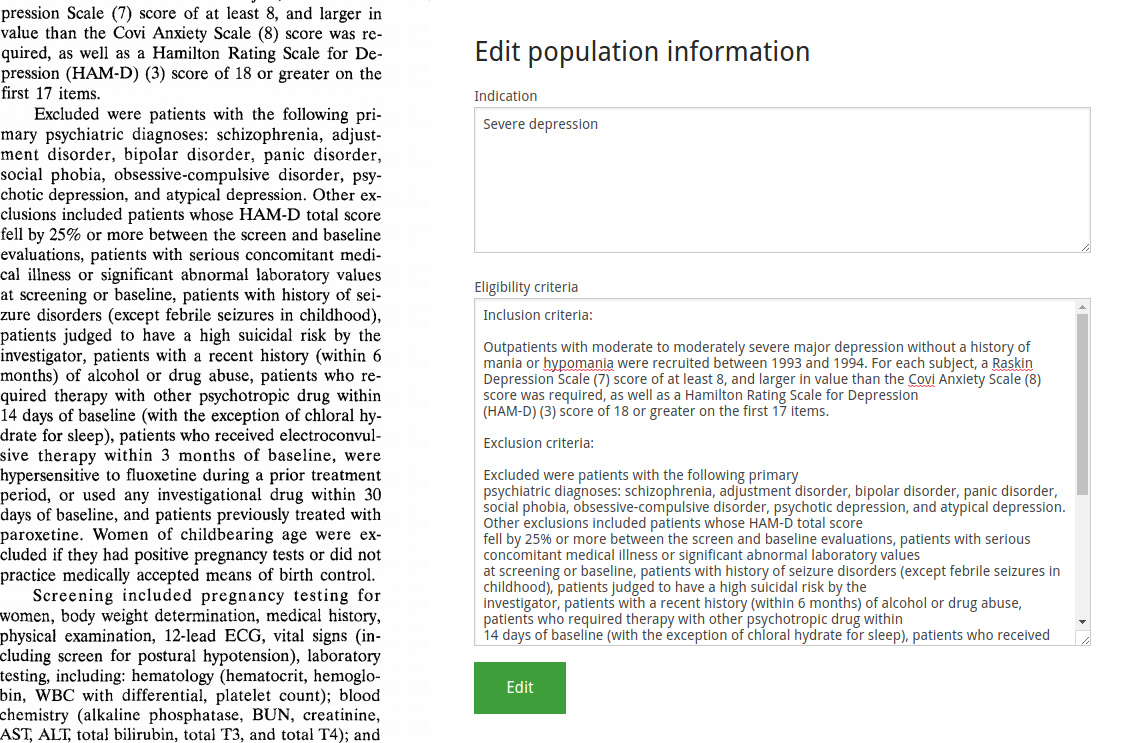
Second, we find the population information. Note the illustration is somewhat abridged to save space.
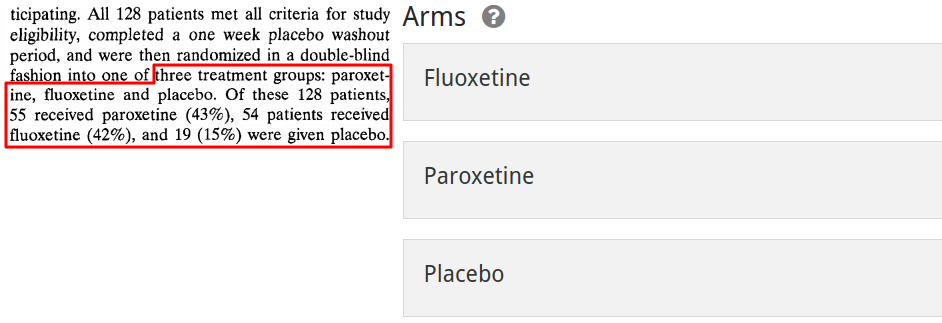
Next, we enter the arms. These are abstract containers that divide the population into subpopulations, and correspond to that group's flow through the study protocol. You can give these any name you wish, but we recommend to name them according to the treatment this subpopulation will receive. If multiple arms involve the same treatment in different dosages, including the dosage in the arm name is also a good idea. The goal is to be able to distinguish arms at a glance from their name, and to be able to make an educated guess as to what happens in that arm.
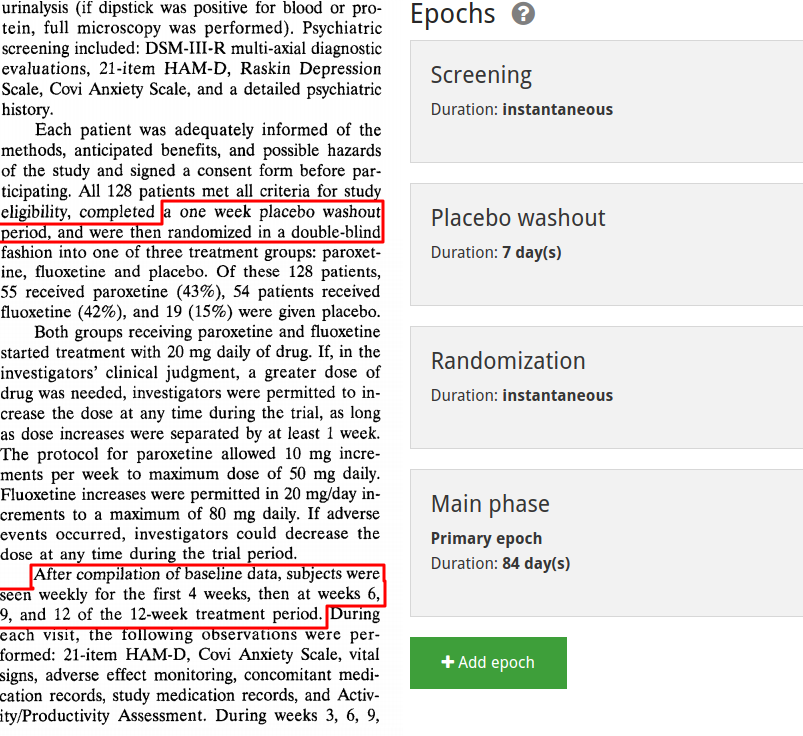
Now we enter the epochs. These are a set of abstract segments intended to represent the different parts in time of a subject's participation in a study. They may have an optional duration. It is possible to indicate for one epoch that it is the primary (treatment) epoch. NB: For study data to be used in ADDIS analyses it is necessary to indicate which epoch is the primary treatment epoch.
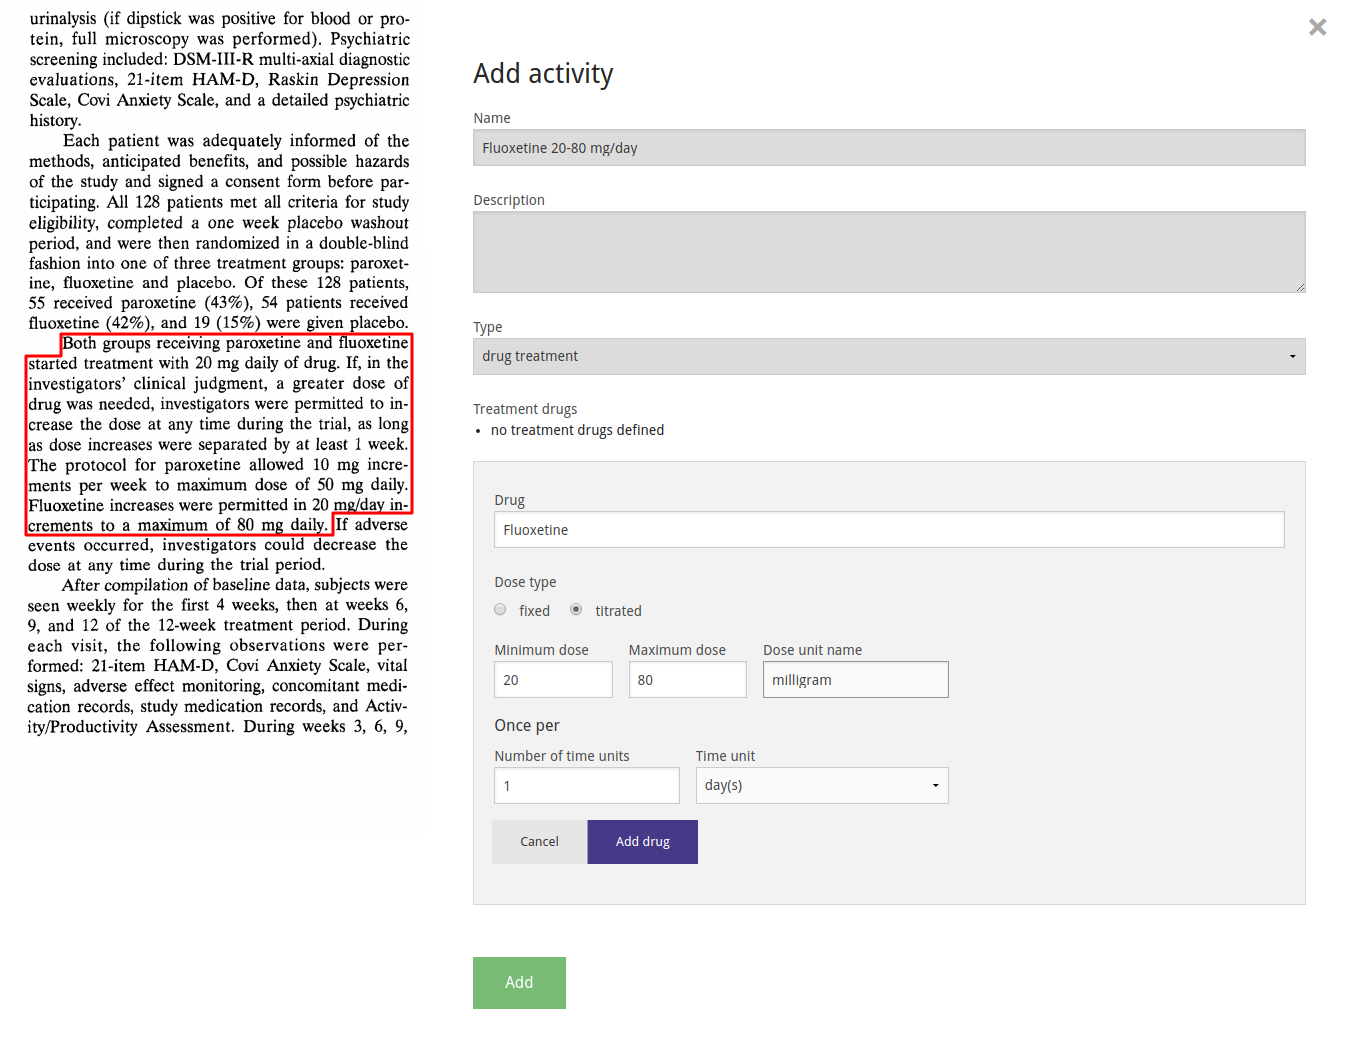
Next comes creating the study's activities. These represent everything that is done to the participants of the study. You can give them any name, but we recommend a descriptive one, e.g. 'Canaglifozin 1000mg QD + Metformin' for a combination/background treatment. The activities currently supported by ADDIS can be divided into two categories, abstract ones such as randomization and screening, and concrete (drug) treatment activities. In the image we show the definition of a drug treatment. After selecting the 'drug treatment' activity type, an 'add drug' button becomes available. ADDIS supports mixed treatment activities, and therefore lets the user add multiple drugs to a single treatment activity.
A common mistake is to add all the drug treatments for a study to a single treatment activity. Only drugs that are actually given together should be added to a single activity.
There are several things to pay close attention to here. First, make sure to consistently choose the same name for the same unit (eg. don't mix mg and milligram). Second, it's only possible to actually create the treatment activity once you've finished the drug addition process (note that in the screenshot the bottom 'add' button is disabled because we haven't clicked 'add drug' yet).
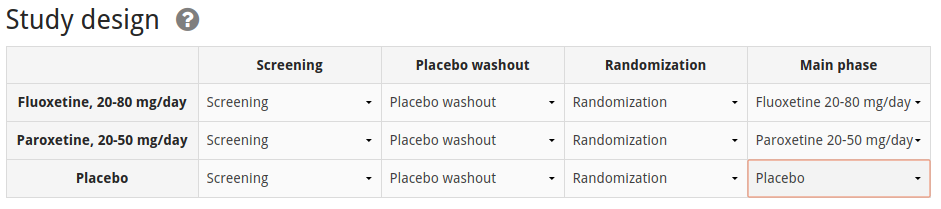
We combine the definitions created above by filling out the study design, indicating which activity takes place for each arm in each epoch.
The study only reports measurements for baseline (i.e. before treatment, at the beginning of the main phase) and at the end of the main phase, so we define those two measurement moments as options for which to enter measurement data. NB: For data to be automatically included in analyses by ADDIS it is necesary to select a measurement moment at the end of the main phase.
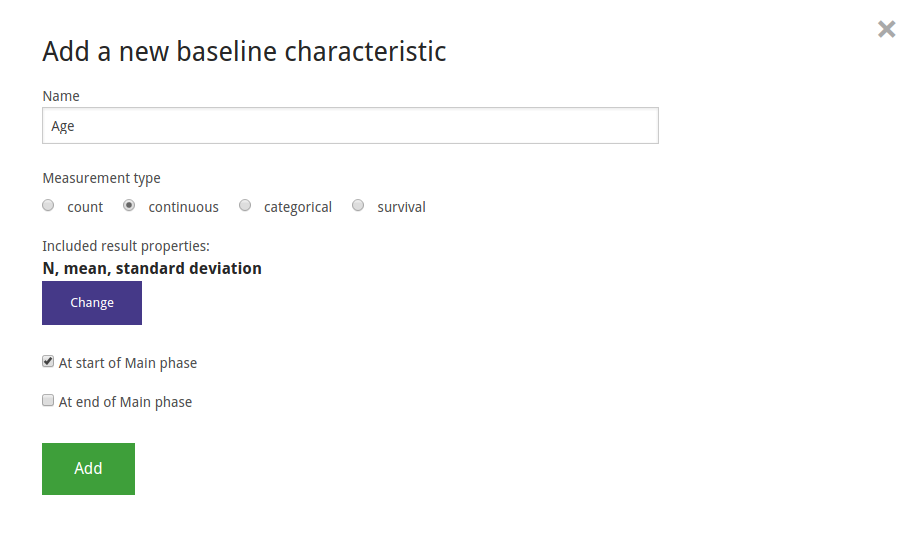
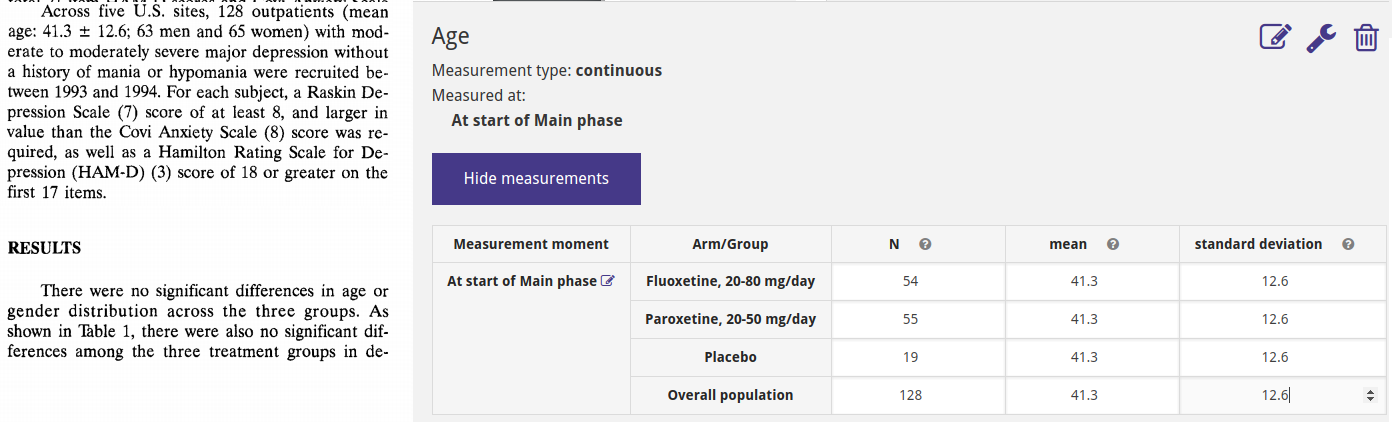
In ADDIS, data can be entered for three types of variables: Baseline (population) characteristics, Outcomes and Adverse Events. Here we show the example of creating and entering the data for the Age baseline characteristic. Age is measured at the baseline, i.e. the beginning of the main phase so we only select that measurement moment. It is stated in the paper that there is no significant different across arms for age, so we enter the same values for all groups. Note that it is possible to change the result properties for each variable, but not all result properties are supported for analysis yet.
Finally, we ensure that the concepts from our study are correctly mapped to the dataset level concepts that we defined earlier.
Checklist: getting to "analysis ready"
To ensure your studies are picked up for analysis in ADDIS, it is important that they are entered accurately and adhere to some best practices. Pay attention to the following:
- There are at least two arms
- The epochs have been defined, and a primary epoch has been chosen
- There is a measurement moment defined at 0 days before the end of the primary epoch (due to a limitation in how analyses are defined, only measurements at this measurement moment will be used in analyses)
- The study design table is complete: there is an activity selected at each cell of the table
- In the primary epoch, a (different) treatment activity has been selected for each arm (these will be recognized as the treatments being compared)
- The outcomes of interest have measurement data at 0 days before the end of the primary epoch
- The outcomes, drugs, and units of interest are mapped to dataset level concepts
- The measurement data is specified using the attributes recognized for analysis:
- For continuous outcomes: mean, standard deviation, sample size
- For dichotomous outcomes: count, sample size
- For survival outcomes: number of subjects with event, total exposure time
Study repair
In general, when you import a study from ClinicalTrials.gov, it is likely that some of the data will not be structured correctly. Repair tools are available to correct several of these problems, as outlined below. These tools are accessed using the wrench icon () in the user interface.
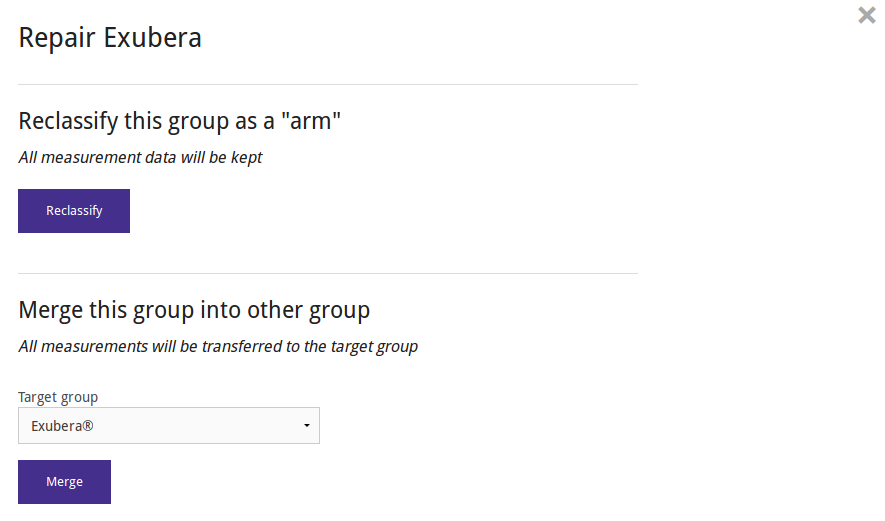
Studies from ClinicalTrials.gov do not have arms, but only groups. You can change the appropriate groups into arms (preserving all associated data), by using the "reclassify" study repair tool.
There might be duplicated or otherwise redundant outcomes, groups, or measurement moments. For example "headache at week 13" and "headache at week 26" would be considered redundant in ADDIS, because these are just "headache" at two different measurement moments. The study repair tools allow you to merge (combine) such duplicated objects into one.
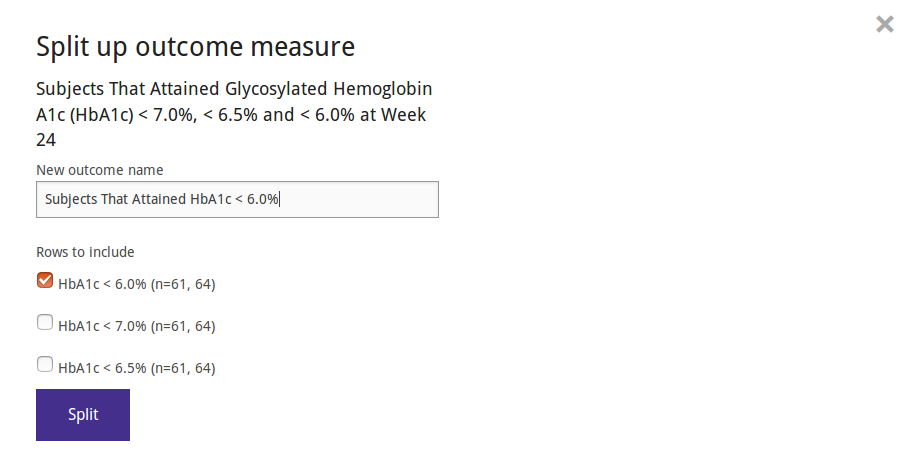
Conversely, the data from ClinicalTrials.gov sometimes contain outcomes that actually report data on multiple outcomes, for example on several related (but distinct) biomarkers. These will have non-conformant measurements with row labels indicating which measurements belong to which outcome. You can separate such data into new outcomes.
Where necessary, it is possible to assign non-conformant measurements to a specific measurement moment (note that you may first need to enable the measurement moment for that outcome).
Analysis projects
In ADDIS, a project consists of definitions and analyses, and is based on a specific version of a specific dataset. Within a project, concepts are defined based on the concepts from the dataset, i.e. interventions, outcomes and covariates. Using these concepts and the data from the dataset, ADDIS automatically assembles analysis data tables. The project report tab gives an overview of the project and analyses, while the details tab provides a detailed view that allows you to edit the project.
Creating a project
All projects must be based on a dataset. We have highlighted a few high quality datasets as 'Featured datasets' on the ADDIS home page. These are a good starting point to try out some of the analysis features in ADDIS without having to enter your own data. To create a project from a dataset, click a 'Create project' button and fill in in a name and description for your project.
The 'Create project' button is available on the featured datasets, on the dataset overview for a specific user, and when looking at a specific dataset. The created project will be based on the latest version of the dataset, except when viewing an older version of a dataset, in which case the project will be based on that version.
Defining concepts
It is necessary to define concepts within a project to determine precisely which concept from the dataset we are interested in. In several cases it is also possible to restrict, refine and split out dataset concepts into precisely the project concepts we need. For example, you can create both the treatment concepts Paroxetine (high dose) and Paroxetine (low dose) based on the dataset concept of the drug Paroxetine, but with different dose restrictions. You may fill out a motivation explaining why you made this specific definition. Defining project concepts is done from the 'Details' view of the project.
Defining outcomes
At the moment, outcome definition is simple: select an variable concept from the dataset (population characteristic, adverse event or endpoint), and choose the name under which to use it in the project.
Defining units
The definition of a unit is a combination of a metric multiplier and a dataset level unit concept e.g., milli and gram.
Defining covariates
Covariate definition is simple: select which covariate to use (either a population characteristic or a study characteristic), and choose the name under which to use it in the project.
Defining interventions
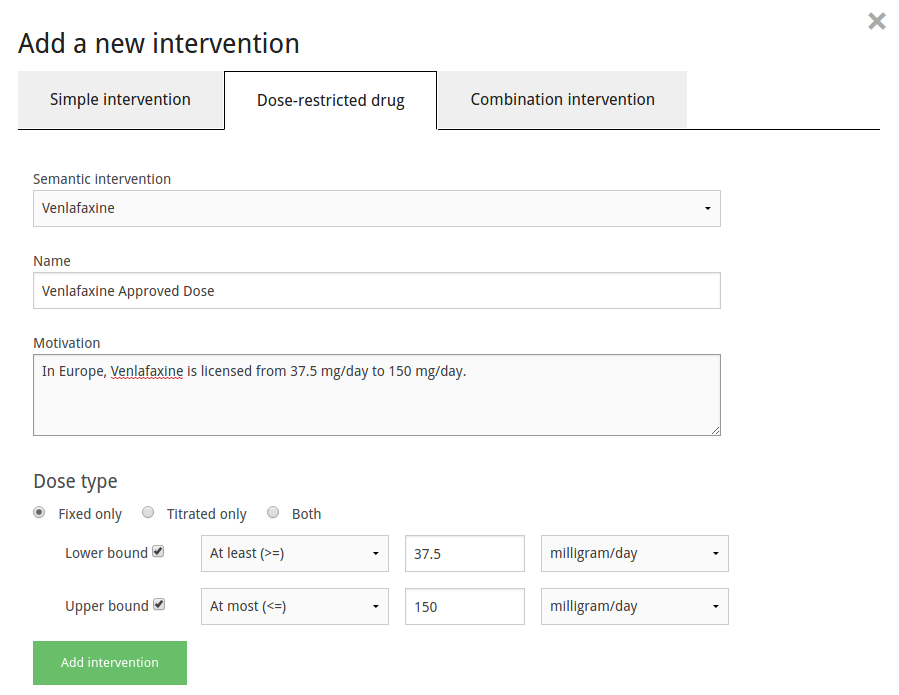
Intervention definition is potentially the most complex of the project concept definitions. Interventions can have dose-restrictions placed on them, or can be defined as combinations of previously-defined interventions. To create a simple intervention, select which drug concept from the dataset to use, and choose the name under which to use it in the project. To create a dose-restricted intervention, click the 'Dose-restricted' tab in the intervention creation dialog. Here, besides choosing the desired name, you can choose the type of dose the intervention should have, as well as set upper or lower bounds for the dosages.
To create a combination intervention, click the 'Combination intervention' tab in the intervention creation dialog. Here, besides choosing the desired name, you choose the already-defined interventions of which the new intervention is a combination.
Project report
The project report view shows an overview of the project's definitions, and the most important results of each analysis that has been performed within the project. It lets you compare and contrast the results of analyses without needing to navigate to each analysis' model results individually. First, an overview of the defined concepts is shown (outcomes, interventions, covariates). Second, for each evidence synthesis analysis the relative effects of the primary model are shown, as well as a list of the secondary models. Third, all benefit-risk analysis based on a single study are shown, with their effects table and rank acceptability plot. Fourth, all benefit-risk analysis based on evidence syntheses are similarly shown.
Evidence synthesis
In evidence synthesis, results from multiple primary studies are pooled to derive an overall estimate. Evidence synthesis includes many methods, including pair-wise meta-analysis, network meta-analysis, and meta-regression.
Although this manual contains a brief introduction to the terminology and methodology, it is not a complete guide to evidence synthesis. For further background, we recommend the following excellent open access publications:
- The Medical Decision Making series on network meta-analysis based on the NICE Decision Support Unit series on evidence synthesis: Table of Contents, MDM 2, MDM 3, MDM 4
- The ISPOR guidelines on network meta-analysis: ISPOR 0, ISPOR 1, ISPOR 2
- Evaluating the quality of evidence from a network meta-analysis: Salanti et al. (2014)
Evidence synthesis in ADDIS is based on the GeMTCpackage for the R statistical software.
Creating an evidence synthesis
To create an evidence synthesis, first make sure you have defined the outcome, interventions, and covariates you wish to include in your analysis. Then, on the analyses tab of the project overview, choose "Add Analysis". In the pop-up dialog, enter a title for the new analysis, and choose "evidence synthesis" as the analysis type.
After this, you will be taken to the analysis overview screen. Here, you select the outcome, interventions, and covariates you wish to include. Based on this, ADDIS will automatically populate an evidence network and evidence table. Check whether the evidence table includes the studies you were expecting. You may also use this screen to exclude any arms or studies that are inappropriate. Studies with only one included arm will be excluded automatically.
Once you are happy with the evidence network and evidence table, you may use the "Add model" button to start defining models. As soon as you create the first model, the analysis and evidence table will be locked, meaning that you can not make further changes to it. Defining models will be described in more detail in the following sections.
Benefit-risk analysis
Benefit-risk analysis in ADDIS is based on the SMAA package for the R statistical software.
Creating a benefit-risk analysis
In ADDIS, benefit-risk analyses can be based on either a single study, or on a set of network (consistency) models.
Creating a single study benefit-risk analysis
To create a single study benefit-risk analysis, first make sure you have defined the outcomes and interventions you wish to include in your analysis. Then, on the analyses tab of the project overview, choose "Add Analysis". In the pop-up dialog, enter a title for the new analysis, and choose " Benefit-risk analysis based on a single study" as the analysis type.
After this, you will be taken to the analysis overview screen. Here, you select the criteria, alternatives, and study you wish to include. Based on this, when you press "Perform MCDA Analysis", all options will become locked, and you will be taken to the MCDA module of ADDIS, where the benefit-risk analysis will take place, as described in the next sections.
Creating a meta benefit-risk analysis
To create a meta benefit-risk analysis, first make sure you have defined the outcomes, interventions, and network meta-analyses you wish to include in your analysis. Also make sure that those network meta-analyses have consistency models that have been run, and use the outcomes and interventions. Then, on the analyses tab of the project overview, choose "Add Analysis". In the pop-up dialog, enter a title for the new analysis, and choose " Benefit-risk analysis based on meta-analysis" as the analysis type.
After this, you will be taken to the first step of the meta benefit-risk analysis creation process. Here, you select the alternatives, outcomes, and, for each outcome, which network meta-analysis and model you wish to include. When you are done, after pressing "Next Step", you are taken to the second meta benefit-risk analysis screen. Here you set the baseline distributions for each included outcome, and see the corresponding absolute effects table. If a baseline distribution was already defined for an outcome's network meta-analysis model, it will be selected by default. You can set or override a baseline distribution by clicking the "Set" button, next to an outcome. This allows you to select the alternative you which to use as a baseline, and what the mean and standard deviation of the normal distribution should be. Once all distributions are set, the "finalize" button will become available, which locks all selections, takes you to the MCDA module of ADDIS where the benefit-risk analysis will take place, as described in the sections below.